

2016 26.1 Snapshot of Organic Food and Farming
Washington State and Beyond
Nothing grows forever. But there appears to be plenty of room for growth for organic food and farming in our state, country and around the world. A new report from the USDA helps to update our understanding of the organic sector in the US. The USDA National Agricultural Statistics Service (NASS) released the results of their 2014 organic producer survey in September 2015, in which they gathered extensive data from both certified and exempt growers (www.agcensus.usda.gov/Publications/ Organic_Survey/). The recent survey used questions similar to the 2008 NASS survey, which allows for a reasonable comparison between data from the two survey years. Of course, as with any survey, there are gaps in the data as not all people participate. In 2014, there were 14,093 organic growers in the US (certified plus exempt), of which 90% were certified. Certified farms represented about 0.6% of all US farms, up from 0.5% in 2008. The number of certified farms in 2014 was up 16% from 2008.
Organic on a Global & National Scale
Globally, about 1% of all farmland is under organic management, as is 0.4% of US farmland. National organic acreage declined 9% from 2008 to 2014, ending at 3.64 million certified acres. This value is probably low given the over 5 million acres recorded by the USDA Economic Research Service in 2011 when they inventoried actual certifier data. However, sales from US organic farms rose 72% from 2008 to 2014, reaching $5.46 billion for crops, livestock, and livestock products. This represents roughly 1.3% of all US farm sales. Contrast this with the estimated $36 billion in retail food sales for organic products in the same year and you see both the value-added through the food system and a considerable amount of imported organic products. Many companies report that they are still supply-constrained, which spells opportunities for growers to enter into or expand their organic production.
The annual growth in US organic food sales (Figure 1) of 11-12% in recent years mirrors international trends. “The World of Organic Agriculture 2015”— an excellent resource for anyone interested in global trends (www.organic-world.net/index.html)—estimated global organic food sales at $72 billion at the end of 2013. Currently North America (49%) and Europe (43%) make up virtually the entire global market for organic foods. Markets are developing in other countries such as China and India, but are extremely small at the moment. However, there is tremendous potential for increased demand from these countries. Even in developed markets like Switzerland, with the highest per capita expenditure on organic food at 5% of food dollars, organic still is a small share. Thus, for the foreseeable future, increasing production to meet demand is both the challenge and opportunity.

Figure 1. Growth of US. retail organic food sales (source: OTA, Nutrition Business Journal).
Organic in Washington
For Washington State, the authors gather data directly from certifiers each year that helps track the trends for organic farming over time. The number of certified organic farms and acres in Washington peaked in 2009 (Figure 2), declined through 2013, and rose in both 2014 and 2015. This year (2015) there were 710 certified farms and 91,500 certified acres. Also, the number of farms with transition sites is up (49 certified farms with transition land; 21 new farms in transition).
Despite declining acres, gross farmgate sales have steadily increased since 2009, similar to the national trend. Sales reached over $515 million in 2014, and this does not include the value added for handling and processing, which cannot currently be estimated. Statewide sales grew 23% in 2013 and about 15% in 2014. In 2015, Grant County remained the leading organic county in the state (with highest number of farms, acres, and sales), while Skagit County led in all three measures in western Washington. Eastern Washington, especially the irrigated counties in the central part of the state that produce many high value crops, accounted for 64% of the certified farms, 68% of the certified acres, and 88% of the farmgate sales in 2014.
Organic farming in Washington is still dominated by forages, tree fruits, and vegetables, accounting for about 75% of harvested organic acreage. Tree fruit area has slowly increased, and large increases are expected in the next few years (60-70% more, based on grower surveys). About 9% of all apple area is certified organic. Vegetable area has reached its previous high and is expected to grow further. Acres of organic wheat appear to have jumped 85% in 2015, and organic blueberry acreage has doubled in the past five years with additional land in transition. Organic dairy cow numbers have increased from a low in 2010 and now account for about 3% of the state dairy herd. State organic trends based on the certifier data have been updated for 2014 and can be found at csanr.wsu.edu/trends-in-washington-agriculture/organic-statistics/. In addition, several recent WSU Extension publications are available for specific crops (berries, vegetables) that contain trend data along with analyses of yields, prices, and revenue per acre.
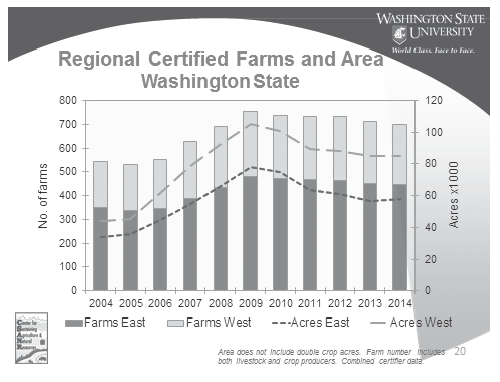
Figure 2. Washington certified organic farms by acre, by region, 2004-2014.
How Washington State Ranks Nationally
The 2014 data from USDA provide insight into the role Washington state organic producers play in the national picture. Washington ranked 2nd, 4th, and 9th respectively, for farmgate sales, number of certified organic farms, and acres in the US. The state represented 9%, 5%, and 2% of these same parameters nationally: commercial sales, number of certified organic farms, and certified acres.
Washington is a leading national producer for several fruits and vegetables (Table 1), as well as for other specialty crops such as hops, mint, certain vegetables seeds, and eggs. Washington producers dominate the national production of organic apples, pears, cherries, and juice grapes. Nationally, California is by far the leading state for organic agriculture overall. Wisconsin has the second highest number of organic farms. Pennsylvania overtook Oregon as #3 for total organic farm sales, while Oregon appears to be the #2 organic vegetable producing state.
The USDA National Organic Program has implemented the first step of its new data management effort, and the new database of certified operations is up and running apps.ams.usda.gov/integrity/ . The goal is to have a more current list of who is or is not certified. Ultimately, they hope to have more real time information on specific crop acreage as well, which will be a great help to the organic sector in terms of trying to balance supply and demand.
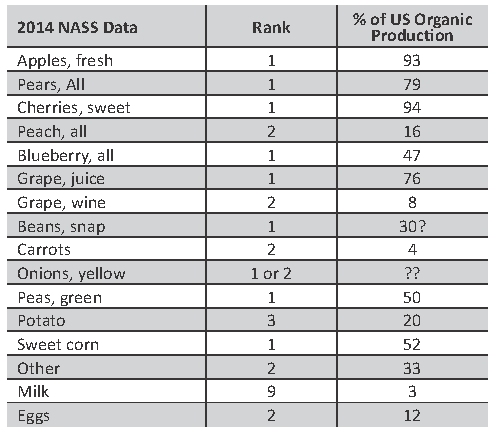
Table 1. National rank of various Washington organics, products, and estimated share of all US production (source: NASS, 2015).
Overall
The data offers several take-home messages. First, demand continues to outstrip domestic supply. Opportunities exist to grow organic products of many types for many markets. As seen with tree fruits, the three-year transition often leads to a lag in response by producers, which can create temporary excess supply when many acres become certified at one time. But overall, there is room and need for more production. Secondly, Washington is in the enviable position of being a dominant producer of a number of organic products, and if production can be ramped up in line with increased demand, strong prices can be sustained. Thirdly, organic remains less than 1% of all farms and farmland nationally (about 2% within Washington) despite decades of growth, so the impact on communities and the environment remains quite small.
What is not captured in these numbers is the impact that organic production has on “conventional” production—sometimes on the same farm, other times throughout the broader industry. It is possible, and even likely, that this impact is larger than that of the organic farmland itself. Finally, information about the organic sector is steadily improving. This includes data on the organic sector as presented here, as well as more resources on organic production techniques. The eOrganic website (www.extension.org/organic_production) and the ATTRA website (attra.ncat.org/) both offer a wealth of practical information on many topics, much of it based on current scientific knowledge as well as real-world experience. Increased information should lead to better decisions and more successful organic farms.
Both David Granatstein and Elizabeth Kirby are with the WSU Center for Sustaining Agriculture and Natural Resources in Wenatchee and have led development of organic statistics for the state for more than ten years. (509) 663-8181, [email protected]
