

2017 27.1 Snapshot of Organic Farming 2016
Global, National, and State Data
Three words generally describe the organic food and farm sector in the last several years: “demand exceeds supply.” Global sales (demand) of organic foods rose to $80 billion in 2014, up 11% over the previous year, according to the World of Organic Agriculture Report.
North America accounted for 48% of this demand, while the EU made up 44%. Demand is growing in Asia, and organic sales in China for 2014 were estimated to be 3.7 billion euros (fourth largest by country) compared with 27.1 billion euros for the U.S., the largest individual country market. The Organic Trade Association, other industry groups, and many companies all report that there are major supply constraints for organic products and that sales would be higher if there was more product to source.
The amount of organic land is expanding to support the demand, but still only comprises about 1% of global agricultural land (cropland, permanent grassland and other) or 108 million acres. North America had an estimated 7.6 million acres of agricultural land under organic management in 2014. The organic share of individual crops and crop groups is still quite small: about 0.5% of global cereal, vegetable and oilseed acres are under organic management, compared with 4.6% of grapes and 7.2% of coffee. For more details on the composition of organic land around the world, look at the presentation by Willer and Lernoud.1 A new EU report estimates that 6.2% of total utilized agricultural land in the EU-28 is under organic management, considerably higher than the global average. The EUROSTAT system appears to be doing a good job of collecting statistics on organic production on an ongoing basis to allow for accurate trend development.
In the U.S., the National Agricultural Statistics Service (NASS) released another organic production survey covering 2015. The report is similar to the NASS 2014 survey.2 Both surveys had about 60% participation rate nationally and for Washington state, so the data are incomplete. NASS is also working to gather data directly from all certifiers for 2014 and 2015 organic land, which should be more complete, but the level of detail will be less than in their producer surveys. The NASS survey also collects production (e.g. lbs) and sales value ($) data, which the certifiers do not normally have. A summary of the NASS data and Washington’s rank (using NASS data) is presented in Table 1.
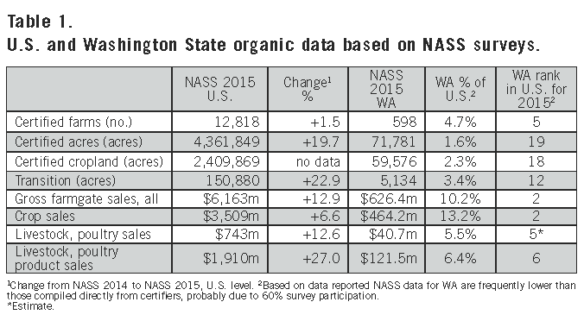
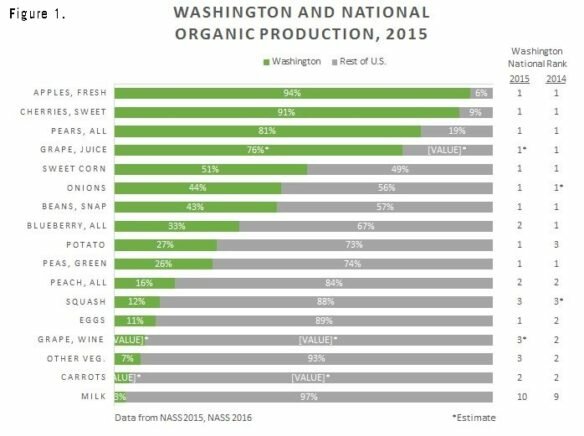
While California remains the top state for most aspects of organic agriculture, Washington is a leading organic producer as well. The state has retained its place as the state with the second highest level of gross farmgate organic sales despite falling in the rankings for total number of organic farms and organic acres over the years. Washington had about 2% of the 2015 certified organic cropland in the country but accounted for over 13% of the national crop sales, reflecting the predominance of higher-value crops produced. The state had the highest estimated per acre sales value at $7,792 per acre. In Washington, crop sales accounted for 74% of total organic sales, compared with 57% nationally. Milk, eggs and broilers were the main livestock products sold. Based on the NASS estimates, Washington continues to be the leading producer for a number of products including apples, pears, cherries, juice grapes, snap beans, green peas, sweet corn, onions, potatoes, hops and eggs (Figure 1). The state’s estimated share of national production rose for potato and snap beans and fell for green peas, other vegetables and blueberries.
Preliminary State Data for 2016
A detailed report on the organic sector in Washington for 2015 is based on data from the various certifiers in the state.3 The values reported below are based on WSDA-certified farms only, which account for 94% of the certified farms in the state. However, WSDA changed to a new database system in 2016 that will create complications for making comparisons with past years, particularly for total organic land area. Acres of cover crop, fallow, CRP and timber land used to be included in the WSDA totals (we called them ‘Other Land’) but they no longer are. In 2015, these land uses amounted to 5,648 acres, but they were not included in the 2016 totals. Comparisons of total organic land between 2015 and 2016 are therefore skewed by this change. In 2015, there were 89,000 acres of WSDA certified organic land, including double crop acres and the ‘Other Land’ mentioned above. For 2016, the organic land area was 94,434 acres, an apparent 6% growth. If the ‘Other Land’ area is subtracted for 2015 and that result (83,352) is compared with the 2016 estimate, then growth in certified land increases to 13%, probably the more accurate value.
Registered “transition” acreage grew 70% from 4,599 in 2015 to 7,807 acres in 2016. There were an estimated 38 farms in transition to organic in 2016 (with no certified acres), compared with 22 in 2015.
There appear to be large increases in acres of grain (particularly wheat, up 3,590 acres or 47%) and dry beans (up nearly 2,000 acres or 150%) in 2016. Small fruit (berries and grapes) acreage changed little, while herb acreage increased 10% (120 acres). Apple area, at 16,000 acres, indicates that total certified area exceeds the previous high of 15,735 acres (all certifiers) in 2009. There were an additional 4,000 acres of apples registered as Transition, with other transition acres in process but not registered with a certifier. Pear acreage increased about 6% (125 acres), while sweet cherry acreage decreased about 1%. Vegetables reached a new high of 22,200 acres, with sweet corn and green peas as the largest crops.
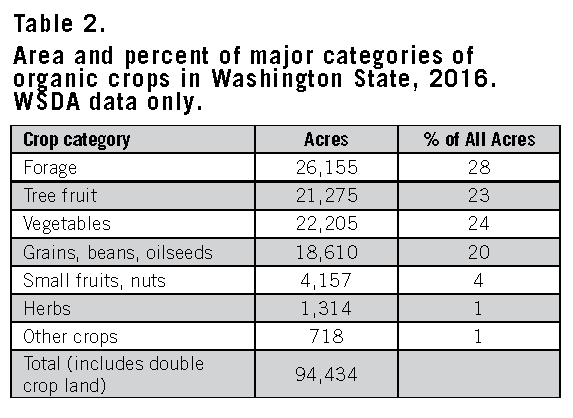
Using the preliminary WSDA data, the size of the different categories of organic crop land is presented in Table 2. There were nearly 7,000 acres certified by other certifiers in 2015, a large share of which was dairies that add considerably to the forage category. There were also several hundred acres of tree fruit with other certifiers. So, as in the past, forages remain the top crop category in area, followed by tree fruit and vegetables. The percent of acres in the grains category expanded since last year.
Data are not yet available for livestock for 2016. In 2015, there were 8,290 milkers and dry cows under certification, up 10% from the previous year (combined certifiers). These cows represented an estimated 3% of the state’s dairy herd. Six dairies were pending certification, suggesting further growth for organic dairy. Based on NASS data, the state produced an estimated 93.6 million lbs of organic milk in 2015, up 53% from 2011. Organic egg production rose over 70% from 2014 to 33.5 million dozen.
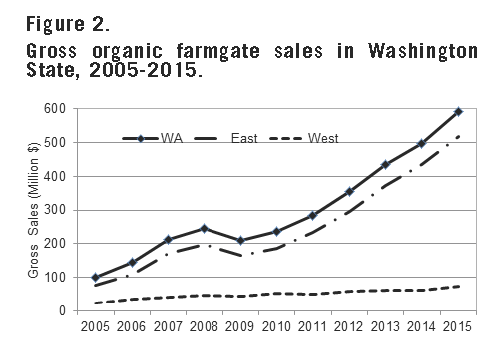
Our estimates of gross farmgate organic sales (certified only) include data from the main certifiers. For 2015, we estimated statewide certified organic sales to be $592 million, with 87% coming from counties east of the Cascades. This is a 20% increase from the previous estimate in 2014. The growth of organic sales is shown in Figure 2. The 2015 NASS value for Washington organic sales was $626 million. Some areas where we do not have good sales information include organic wine grapes (much of this is reported as finished wine), broiler production, mushrooms and some dairy. The 2015 NASS survey does not give a dollar value for broiler chickens or milk.
But using the same price as for Oregon ($33/cwt, based on NASS 2015 data), Washington organic milk would have been worth about $31 million at the farm. Washington produced nearly $87 million of organic eggs in 2015 (NASS data). Organic apples, at an average price of $42 per box F.O.B. for the 8.1 million boxes sold (includes packing related charges), brought in $340 million for that one crop. The price premium for organic apples was approximately $20 per box, so organic production added over $160 million of gross income to the state’s orchardists (tree fruit industry data).
Organic land area should continue to expand since demand is expected to keep growing. Washington is a dominant producer for many important organic products and has an established reputation as a supplier. Some companies looking to increase their supply are working with growers on different support strategies for transition, such as providing a direct financial incentive during transition so the crops are dedicated to the buyer upon certification. This reduces market risk for the grower as well as some of the risk and added cost during the transition period. There are additional opportunities being offered for interested growers to link up with potential buyers, such as the Pacific Northwest Vegetable Association organic session that was held in Kennewick in November. The USDA is providing access to more organic information via the National Organic Program (e.g., the public access Organic Integrity Database) and the Agricultural Marketing Service (AMS). AMS has a variety of organic market data products available, including dairy, fresh produce, grains, livestock and retail prices.4 A number of Extension publications are available from WSU and OSU regarding various crops in the region and soil and nutrient management in organic systems. The WSU Organic Statistics web page accesses most of the previous reports done on the state’s organic sector and hosts new reports as they are released.5
David Granatstein and Elizabeth Kirby, WSU Center for Sustaining Agriculture and Natural
Resources, Wenatchee, WA
1 orgprints.org/29790/13/willer-lernoud-2016-global-data-biofach.pdf
2 nass.usda.gov/Surveys/Guide_to_NASS _Surveys/Organic_Production/index.php
3 csanr.wsu.edu/wp-content/uploads/2016/09/WA_OrgStats_-ann_rev_2015.pdf
4 ams.usda.gov/market-news/organic
5 csanr.wsu.edu/trends-in-washington-agriculture/organic-statistics/
